2. About charts and graphs
What is the difference between a chart and a graph?
How can we use charts and graphs?
How can we be tested using charts and graphs?
|
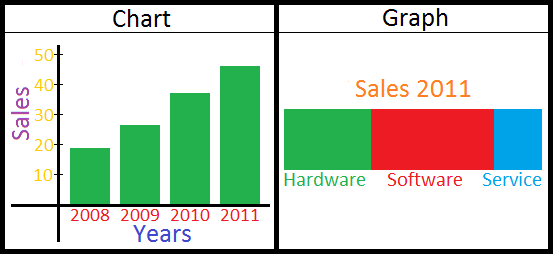
Charts and graphs are a means of displaying information in a way that's easy to digest. Through lines, bars or other visual representations, both charts and graphs illustrate relationships between sets of data so that anyone can understand them. Even though charts and graphs are often used in the same sentence to explain the illustration of data, technically speaking, the terms are not interchangeable because they illustrate relationships between data in different ways. Graphs, especially line graphs, are best for illustrating a trend over time. They are much better at showing trends for a single set of data than charts are. Charts are useful for displaying patterns or information about frequency. The bars on a chart are higher or longer depending on the value they represent. |
Image by Stackoverflow in Stackoverflow . License |
Sources: Labbe, M. (n.d.). The Difference Between Charts & Graphs. Retrieved May 27, 2016, from http://www.ehow.com/list_7385398_difference-between-charts-graphs.html
and What is the difference between a chart and a graph? (n.d.). Retrieved May 27, 2016, from http://www.ask.com/math/difference-between-chart-graph-8775a512630cf520
|
In Lesson 1, section 4, you were introduced to your first graph and some language describing trends. A trend, or pattern of change, can help you make a projection which is a prediction of how the data will change in the future based on the patterns of change in the past and the present. Describing trends and movements requires a specific vocabulary as well as certain structures and tenses. |
 |
|
Click here to view an infograph on the different types of of charts and graphs. |
Image by Thewizardplusplus in Openclipart under Share |
|
Now, let's have a look at some of the structures we may use when describing charts and graphs. |
||
|
Nouns |
Verbs | Prepositions |
|
an increase a spike a plunge |
increase spike plunge soar |
to rise from $1m to $3m to fall from $2m to $1m A rise in sales, |
|
Intensifying Adjectives and adverbs |
||
|
to rise suddenly/ a sudden rise in |
||
Actividad
Have you ever wondered whether "data" goes with a singular or a plural verb? Follow the link to find out:
http://www.theguardian.com/news/datablog/2010/jul/16/data-plural-singular


